Georeferenced Maps - Help
This application allows a set of historical map overlays to be viewed. These are sets of maps that have had their sheet margins cropped and geographical coordinates assigned to the map images to create a seamless georeferenced layer or mosaic, positioned in its correct location in the real world. The application complements our Map Finder application which allows individual maps to be selected and viewed.
Watch a Help video on the Georeferenced Maps viewer. What is georeferencing?
Georeferenced Maps - main Overlay viewer
Top left
- Search using a Gazetteer
- Search by National Grid Reference, latitude/longitude or Postcode
- Search by Counties/Parishes
- Geolocation
- Background map / satellite / LiDAR layers
Top right
Lower left
Footer

Show More Panel
Navigation
Go to other viewers for the same area:

Navigate to the home pages for the particular map series or groups you are looking at:

Main search process


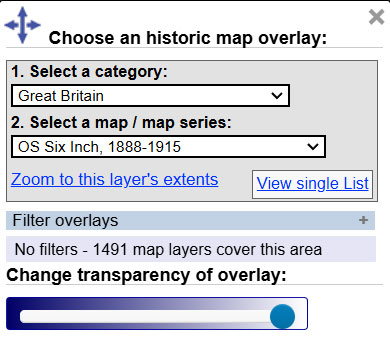
1. Zoom in on your area of interest.
2. Choose the historic map overlay that you would like to search from the left-hand list, and then use the gazetteer or map to zoom in to view the detail of the overlay. Select the Zoom to this layer's extents link to zoom to the full geographic extents of the selected overlay. This is particularly useful for the large-scale town plans, that only display at more detailed zoom levels. As you zoom or pan the main map, the historic overlay lists in the left-hand panel update to show just those that cover the current map view.
3. To take away the historic map overlay to display the background map/satellite layer, slide the transparency slider bar in the left-hand panel to the left.

4. View the mapping in an alternative viewer: for example, the Full Screen/Draw, 3D, or Spy Viewer.
5. You can select different background layers using the drop-down list to the upper left of the map. Select Choose any other layer as background to display and select any of the overlay layers as a background layer
6. Measure distances and areas.
7. Search using gazetteers or by National Grid Reference.
Switch overlay lists (lower left)
You can display the overlays as one single list or as a split list:

You can also sort the single list by Relevance, Scale or Date.
Filter overlays (lower left)
By default, the list of overlays are filtered by the area you are looking at in the map. If you zoom in, the overlay lists reduce to just those covering your smaller area. If you zoom out, the overlay lists increase to those covering your wider area.
You can also filter the overlays by date, scale or keyword:

- Filter overlays by date if you are only interested in overlays between a specific date range.
- Filter overlays by scale if you are only interested in overlays at particular scales.
Check the Filter by scale automatically checkbox if you would like the list of overlays to reflect your map zoom level. If checked, when you are zoomed out (at smaller scales), just smaller scale overlays are listed; when you are zoomed in (at larger scales), just larger scale overlays are listed. - Filter overlays by keyword to only select overlays containing this keyword in their title. Upper or lower case can be used.
What is georeferencing?
Georeferencing assigns geographical coordinates to images of maps, so that they can be located in the real world, and then presented as an overlay on top of a satellite image layer.

Our typical georeferencing workflow for maps in a set or series involves:
- locating the four corners of the map, and cropping away the margin of the map outside of these four corners.
- linking these four corner points to the known real-world coordinates (ie. latitude/longitude points) of the map's corners.
- repeating this process for all the maps in a series, and then processing these together so that they can be displayed as a seamless layer.
For more detail on our georeferencing process, read a paper (PDF, 1 Mb) by C.Fleet, 'Creating, Managing, and Maximising the Potential of Large Online Georeferenced Map Layers', e-Perimetron, 14(3), 2019 [140-149].
Go to Georeferenced Maps viewer.
Search using a Gazetteer (top left)
The Search Button ![]() allows you to search using a Gazetteer of Place Names.
allows you to search using a Gazetteer of Place Names.

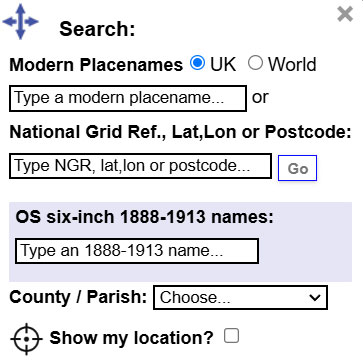
The Gazetteer at the top of the map search panel allows you to locate your area on the map using modern place names from Nominatim, using OpenStreetMap names, as well as the Definitive Gazetteer for Scotland (PDF, 135KB), developed by Bruce M. Gittings, University of Edinburgh, with funding from the Scottish Government. The OSM Nominatim gazetteer is stronger for larger settlements and street names, as well as for its global coverage, whilst the Definitive Gazetteer for Scotland is particularly strong for smaller rural features in Scotland, such as farms and hamlets, mountains, hills, rivers, streams, and lochs. The two gazetteers are searched collectively using the OSMNames technology.
The search on OS six-inch 1888-1913 names gazetteer allows the text strings and place names from the Ordnance Survey six-inch to the mile, 1888-1913 layer to be searched. These are the initial names that have been collected from the GB1900 transcription project. This crowdsourcing project ran from September 2016 to January 2018, and collected 2.6 million names - virtually all the names on this map series covering England, Scotland and Wales. Cleaning and editing of the place name data took place during 2018 and it can be downloaded from the Vision of Britain website. The initial set of names being searched on here are the 2.52 million names where two independent transcribers both agreed on the form of the name, and so they are considered to be more accurate. Parish and county names have been assigned to the transcribed name, based on the point location of the pin, in order to reduce ambiguity and provide geographical context. It is hoped that a more complete and edited version of this gazetteer will be released in future. For further information on the GB1900 Project, see H. Southall, P. Aucott, C. Fleet, T. Pert, and M. Stoner, 'GB1900: Engaging the Public in Very Large Scale Gazetteer Construction from the Ordnance Survey 'County Series' 1:10,560 Mapping of Great Britain.', Journal of Map & Geography Libraries, 13 (1), (2017), pp 7–28, and P. Aucott, C.Fleet and H. Southall, 'The GB1900 project – from the horse’s mouth', Sheetlines 111 (April 2018).
In both cases, the map will then position to the place that has been selected.
Search by National Grid Reference, Latitude/Longitude or Postcode (top left)
You can search by British National Grid Reference - 2, 4, 6, 8, or 10 figures (ie. 'SE12', 'NT1234', 'TQ123456', 'SD12345678', 'SD1234567890'). You can also search using numeric Grid References as Eastings and Northings (ie. '123456,123456'), or by using latitute, longitude (ie. '52.123,-2.345').
You can also search by postcode. You can enter just the postcode area (ie. 'EH'), district (ie. 'EH9'), sector (ie. 'EH9 1'), or to the full unit postcode (ie. 'EH9 1SL'), either with a space in the middle (ie. 'EH9 1SL') or without (ie. 'EH91SL'). This uses the Ordnance Survey Open Names API.
You can use upper or lower case letters for the National Grid Reference or Postcode searches.

When you press 'Enter' or the 'Go' button, the map will then position to the National Grid Reference, latitude/longitude, or postcode that has been entered with a marker pin on the location. The map zoom level will reflect the scale of the map overlay, zooming to higher levels if you have a larger-scale map overlay selected.
Go to Georeferenced Maps viewer.
Search by historic counties and parishes (top left)
Further down, drop-down boxes allow counties and parishes (based on their names and boundaries in the 1940s) to be searched. When you select a county, the parishes within that county appear as a second drop-down list, allowing you to select the parish.
We gratefully acknowledge OpenStreetMap, Ordnance Survey, and Bruce M. Gittings, University of Edinburgh for allowing us to use these gazetteers, and the Vision of Britain project for allowing us to use these county and parish boundaries.
Go to Georeferenced Maps viewer.
Show my location? / Geolocation (top left)
Click on the Zoom to my location link just below the Show my location? option to zoom the map in to this location.
Tap on the Zoom to my location link towards the bottom centre of the screen to zoom the map in on this location.
Background map / satellite / LiDAR layers (top left)
By default, the map shows modern Bing satellite imagery as a base layer, and the OS one-inch to the mile, 1885-1900 historic map overlay on top. Select one of the historic map overlay mosaics from the lower left-hand list ( accessible via ![]() )
to view a different historic map mosaic. Ordnance Survey Opendata, Bing Road and Hybrid base layers, ESRI ArcGIS satellite or topo layers, 1920s mapping from the NLS Historic Maps API, or OpenStreetMap mapping are also available as base map layers from the drop-down list to the centre-top of the map. Google map and satellite layers are no longer available as the OpenLayers software we use does not support them, and also because the Google terms and conditions discourage the overlaying of other maps on top of Google layers.
)
to view a different historic map mosaic. Ordnance Survey Opendata, Bing Road and Hybrid base layers, ESRI ArcGIS satellite or topo layers, 1920s mapping from the NLS Historic Maps API, or OpenStreetMap mapping are also available as base map layers from the drop-down list to the centre-top of the map. Google map and satellite layers are no longer available as the OpenLayers software we use does not support them, and also because the Google terms and conditions discourage the overlaying of other maps on top of Google layers.
We have Light Detection and Ranging (LiDAR) coverage at 1 metre or higher resolutions for most of England, Scotland, and Wales. LiDAR allows highly detailed representations of relief or terrain models to be generated, often at spatial resolutions of between 25 cm and 2 metres. Read more about LiDAR layers, how to view them on our website, and their value for landscape research.
To Zoom in on the map, double-click on the map, use the +/- buttons, or hold the SHIFT key down and drag with the mouse to zoom in on a rectangle. To rotate the view hold the ALT and SHIFT keys down and drag with the mouse.
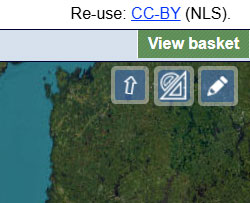
Drawing Tools - Add or Edit Features (top right)

If you select the Draw / Trace Features button ![]() to the upper right, you can draw or trace new features, edit layers, and print or export the results.
to the upper right, you can draw or trace new features, edit layers, and print or export the results.
- You can Create Features, annotating the map, or tracing features. You can add points, lines, polygons or text.
- You can Edit Features, alter feature position, feature style (colour, line and fill properties), or feature text. You can also Delete Features
- You can Print or Save an image of your sketch or tracing at any time using the
 Print Button
 - You can Export your drawing as a KML (Keyhole Markup Language), GPX, or GeoJSON file, saving the geographic coordinates, features and styles of your drawing.
- The KML format includes feature style tags natively, so styles (such as line colour and thickness, or polygon fill colours) can be saved and shared more easily. KML files can also be opened in Google Earth.
- For GeoSJON and GPX files, the styles and attributes are recorded in extensions: GeoJSON simplestyle or GPX Exchange Format.
- The default GeoJSON export projection is WGS84 (EPSG:4326) with latitude and longitude coordinates, but you can also export GeoJSON in the British National Grid (EPSG:27700) with Eastings and Northings in metres by choosing the GeoJSON (BNG) option.
When tracing features such as lines or polygons, a double-click finishes the drawing, so to add points close together, zoom in (with the mouse wheel or pinch zoom) to do this. If you accidentally finish drawing too soon, you can edit the feature to add or alter points.
The downloaded KML, QPX, or GeoJSON files can be brought back into the Georeferenced Maps viewer using the Add Layer button ![]() , for further editing. You can also open them in any text editor, or open and edit them in QGIS or ArcGIS Online. Read our guide on Opening map datasets in QGIS.
, for further editing. You can also open them in any text editor, or open and edit them in QGIS or ArcGIS Online. Read our guide on Opening map datasets in QGIS.
The Draw / Trace Features tool is available in:
- Georeferenced Maps viewer
- Full Screen / Draw viewer
- Side by side viewer
Measurement tools (top right)

These tools, to the upper right, allow you to measure:
- Bearing or Azimuth - in degrees from true North
- Area - in square kilometres and square miles / square metres and square feet
- Distance - in kilometres and miles / metres and feet
Click or tap on the buttons to toggle the measurement functions on or off. Once selected, click or tap to add points on your route - the current bearing, distance or area is given. Single-click with a mouse or tap to stop and finalise the bearing or distance measurement; double-click with a mouse or double-tap to finalise the area measurement.

Go to Georeferenced Maps viewer.
Rotation (top right)
Hold the [Alt] and [Shift] keys down, and drag with your cursor, or pinch with two fingers on a touch screen to rotate the map. Click/tap on the blue arrow to the upper right, or refresh the page to return to the default rotation.

Go to Georeferenced Maps viewer.
Parish and County information (top right)

When viewing maps in England, Scotland, or Wales at zoom levels 13 or higher, select the 'Show parish details?' link to the upper right, to show the civil parish and county that your cursor is hovering over. This is based on parish and county boundaries in the 1950s. For parishes in Scotland, there is also a link to view the specific parish in the centre of the screen, highlighted in our Boundaries Viewer. We have added this to help identify the particular pre-1970s parish when viewing georeferenced maps. For viewing these administrative and other boundaries and information in more detail, please consult our Boundaries Viewer.
Zoom to this map / map series (lower left)
In order to make the location and context of the historic layers clearer, the historic map mosaics are displayed overlaid on a modern Bing satellite backdrop. If your selected layer is not visible, you may need to select the Zoom to this map / map series option.
Add Layer (lower left)
Add your own layer of information to the map, to view and edit it. Or create your own layer.

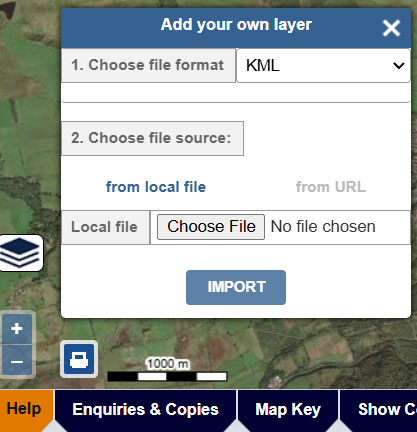
If you click/tap on the 'Add Layer' icon ![]() , to the lower left of the screen, then an 'Add your own layer' panel opens:
, to the lower left of the screen, then an 'Add your own layer' panel opens:
- Choose file format: KML, GPX, or GeoJSON
- Choose file source: browse to find a local file, or paste in a URL for an online file
- Click/tap on the IMPORT button to add your layer. The map should centre on your layer's extents.
For layers with attributes, you can click/tap on the layer to bring up a popup box showing the specific attributes. You can edit the layer with the Add or Edit Features tools ![]() (top right). To remove the layer, click/tap on the Remove top layer link in the lower centre of the screen.
(top right). To remove the layer, click/tap on the Remove top layer link in the lower centre of the screen.
The Add Layer tool is available in:
- Georeferenced Maps viewer
Printing and Image Export/Download (lower left)
You can save, download or print a customised image from any of our georeferenced map layers.
If you click/tap on the print icon ![]() , to the lower left of the screen, then a print panel opens with various options:
, to the lower left of the screen, then a print panel opens with various options:
- Portrait / landscape orientation
- Page size – A4 to A0
- Margin – 0 to 10 mm
- Scale – 1:500 to 1:1,000,000 - set an exact scale for your map
- North Arrow – off or on
- Scale bar – off or on
- Title - off or on (type your own title)

At this stage you can also pan/drag or zoom the map image to make sure its covering exactly the right area of interest.
You can then save the image in various formats – JPEG, PNG, PDF, or copy the image to clipboard. It is also possible to print the map directly to a printer.
The Image Export/Download and Printing function is also available in the Side by side viewer (with Swipe ON).
Please ensure that any re-use of images complies with the relevant re-use conditions.
It is also possible to annotate your image before saving / exporting with our Drawing Tools.
If you wish to obtain a georeferenced map export, please consult our Viewing georeferenced maps guide.
Go to Georeferenced Maps viewer.
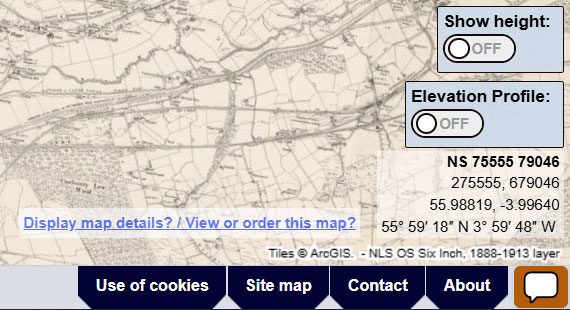
Show height (lower right)

If you switch the 'Show height' button (lower right) to ON, the approximate height of your cursor location is shown in metres and feet. This height data is obtained via the Géoportail Altimetrie Web Map Service, based on elevation information from the N.A.S.A. Shuttle Radar Topography Mission (SRTM3) Global Digital Terrain Model. These heights generally have a horizontal accuracy of 30 x 30 metres, within the main latitudes covered by the SRTM. This coverage does not extend north of 60° North and Antarctica ( view SRTM coverage map ). We have disabled the 'Show height' tool for these latitudes.
This height information may give a general idea of heights when looking at maps without surface heights, bench marks, or contours, but it is likely to be less accurate than the heights that are shown on more detailed, larger-scale mapping (eg. at 1:10,000 scale or larger). The height information may be helpful in giving a general idea of the direction of slope and approximate elevation where this information is lacking from the map you are looking at.
Display map details? / View or order this map? (lower right)
For our largest georeferenced layers, the specific map sheet or sheets that your cursor is over can be displayed to the lower right at higher zoom levels. Select the Display map details link, and the map sheet details will be shown, so you can view specific dates for the maps on screen, followed by a View this map link. If you click this link, it will open the specific map sheet listed as a zoomable image in a new window.

Tips:
- You may need to zoom right in on a specific sheet so that when your cursor moves to the lower right to click the 'View map' link, it is over the same sheet.
- Where map sheets overlap at county or country boundaries, two sheets may be listed which overlay the area shown; one of these sheets will be visible in the georeferenced layer.
If you wish to order maps you are viewing in the Georeferenced Maps viewer, you will need to view the map in our standard non-georeferenced image viewer to order it. Follow the View this map procedure above for this, or switch to the Map Finder viewer by selecting this link in the header to locate the specific map.
Go to Georeferenced Maps viewer.
Elevation Profile (lower right)
For any location in our Georeferenced Maps viewer, you can trace a route on the map to view its elevation profile:


- Switch the 'Elevation Profile' button (lower right) to ON.
- Click or tap a line or route on the map.
- Double-click / Double-tap to finish, and an Elevation Profile popup box should appear showing the elevation profile for your line.
TIP: If you need to click points along your route that are close together, zoom in (with the mouse wheel) so that single clicks are not treated like a double-click, finishing your profile route too soon.
The elevation profile is calculated using MapTiler Terrain-RGB data, with elevation information encoded into the RGB values for each pixel. The horizontal resolution of the elevation data is around 30x30 metres. The elevation information is based on present-day terrain, and may sometimes be different from the former terrain at the time of the historic map overlay layers.
Go to Georeferenced Maps viewer.
Map Key (footer)
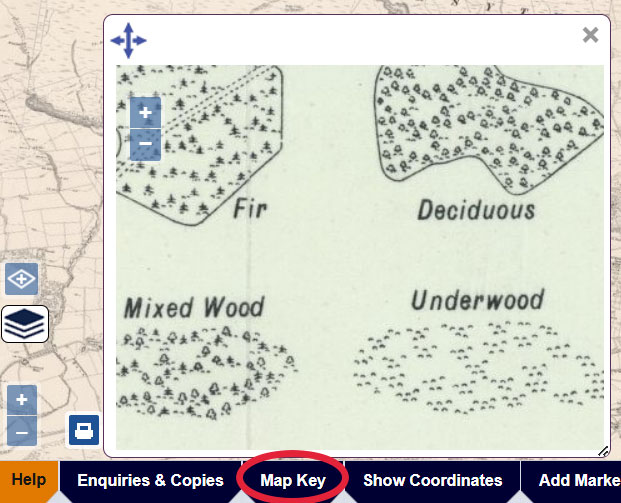
If you select the Map Key panel in the footer, it will open a panel showing a map key (sometimes also called a legend or characteristics sheet) relating to the particular map series you have as an overlay on screen.
- You can zoom in and out of the Map Key graphic to view particular symbols and features
- You can enlarge or reduce the size of this Map Key panel by dragging the lower right corner of the panel
- You can drag the Map Key panel around the screen by selecting the header and dragging with the mouse
- You can close the Map Key panel by selecting the 'X' to the upper right
Please note that the Map Key graphic may not show all the symbols on the map itself, and may not be precisely at the same time as all the maps shown in the georeferenced layer in the main map.
Show Coordinates (footer)
In the lower-right of the map, the location of your mouse position is shown as a British National Grid Reference, as British National Grid Eastings and Northings, and as longitude and latitude, both in decimal and degrees, minutes and seconds forms.
To bring up the real-world location of your cursor as a pop-up so the details can be selected:
- hold the ALT key down and left-click with the mouse.
- click / tap on the Show Coordinates tab in the footer to the lower left.
When you then click or tap on the map, this will bring up the British National Grid Reference, British National Grid Eastings and Northings (EPSG:27700), and the latitude and longitude (EPSG:4326) of the point you have clicked on. You can copy this information to your clipboard.
To bring up the real-world location of your cursor as a pop-up so the details can be selected, tap the More... button (lower left), and then tap on the Show Coordinates link.
When you then click or tap on the map, this will bring up the British National Grid Reference, British National Grid Eastings and Northings (EPSG:27700), and the latitude and longitude (EPSG:4326) of the point you have clicked on. You can copy this information to your clipboard.

Go to Georeferenced Maps viewer.
Adding a Marker (footer)
To add a marker to a specific place on the map:
- hold the SHIFT key down and left-click on the map. If you SHIFT + click a second time, it moves the marker to the second place you click.
- click / tap on the Add Marker tab in the footer to the lower left. Once this is selected, if you click / tap a second time, it moves the marker to the second place you have clicked / tapped on
- tap the More... button (lower left), and then tap on the Add Marker link.
- you can tap on the map to add the Marker to that location.
You can remove the marker by clicking / tapping on the 'Remove Marker' link that appears to the top of the screen when there is a marker on screen.
Whenever there is a marker on the map, the URL has an additional marker=[lat,lon] suffix. You can save this whole URL or pass it on to others, and it will keep the specific marker location on screen (along with other map details, etc.) when you send the URL. The Marker can be added to the main Georeferenced Maps viewer and the Full Screen / Draw viewer.

Links (footer)
If you tap the More... button (lower left), and then tap on the View external mapping sites link, you can view a list of links to external web-mapping services.
The blue Links tab in the footer opens a popup box with a list of links to external web-mapping services.
These include Google Maps, Google Satellite, Bing Maps, Bing Satellite, OpenStreetMap and HERE Maps. If you select these, it will open these map services at the same zoom level and location that you currently have in the Georeferenced Maps viewer.
Overlay (footer)
The blue Overlay tab in the footer opens a popup box with details of the current georeferenced overlay in the viewer, allowing it to be viewed and re-used inside desktop GIS and other software for annotation, tracing or viewing.

The first link in the popup box will take you to a home page appearing like this below (see, for example, the Bartholomew half-inch 1940s layer). Many of our georeferenced layers have home pages in this style, with links to the WMTS and XYZ URLs to the upper right:

The Layer WFS Metadata is the name of the TypeName or Layer in our Web Feature Service, allowing you to see the geographic metadata relating to the specific map within the georeferenced layer. Further details are available on how to use this in QGIS and ArcGIS.
You can Download a GeoJSON file of metadata relating to the georeferenced layer. You can view GeoJSON files in QGIS, in geojson.io, or use the Add Layer tool to view them in our Georeferenced Maps viewer. This GeoJSON file can also be used in MapReader.
Please comply with the specific Re-use terms, as stated for each layer. NLS has default CC-BY re-use terms, but there are layers which have other re-use terms (further information).
Read our Guide to viewing georeferenced maps for advice on how to view these georeferenced overlays inside desktop GIS and other software for annotation, tracing or viewing.
 Bookmarks / Linking to the viewer
The URL in your web browser address bar changes dynamically as you zoom and pan the map, and when you alter visible map layers and overlays. You can copy or bookmark the URL in your web browser address bar to save the current viewer zoom level, location, and layers:
https://maps.nls.uk/geo/explore/#zoom=5.0&lat=56.00000&lon=-4.00000&layers=1&b=1&o=100
- zoom= Map Zoom / Scale / Magnification from 1 to 25
- &lat= Latitude from 0 to 90 +/-
- &lon= Longitude from 0 to 180 +/-
- &layers= Overlay (front) layer (unique number)
- &b= Background (base) layer (unique name)
- &o= Transparency of overlay (front) layer, 0-100
You can create any number of bookmarks to start the viewer focused on a specific location and with your choice of layers.
Go to Georeferenced Maps viewer.
Related georeferenced map viewers
Full screen / Draw viewer
Select the 'Full screen / Draw' button in the Georeferenced maps viewer header to access this viewer:

The Full-screen / Draw viewer provides maximum screen space for the map, by removing the left-hand panel and related drop-down lists. It is also possible to draw points, lines and shapes for annotating features.
If you click/tap on the print icon ![]() , to the lower left of the screen, you can print or save customised images Further information on printing.
, to the lower left of the screen, you can print or save customised images Further information on printing.
Add or Edit Features (top right)
If you select the Draw / Trace Features button ![]() to the upper right, you can draw or trace new features, edit layers, and print or export the results.
to the upper right, you can draw or trace new features, edit layers, and print or export the results.
- You can Create Features, annotating the map, or tracing features. You can add points, lines, polygons or text.
- You can Edit Features, alter feature position, feature style (colour, line and fill properties), or feature text. You can also Delete Features
- You can Print or Save an image of your sketch or tracing at any time using the Print Button
- You can Export your drawing as a KML (Keyhole Markup Language), GPX, or GeoJSON file, saving the geographic coordinates, features and styles of your drawing. In GPX and GeoSJON files, the styles and attributes are recorded in extensions. The KML format includes feature style tags natively, so styles (such as line colour and thickness, or polygon fill colours) can be saved and shared more easily. KML files can also be opened in Google Earth.
When tracing features such as lines or polygons, a double-click finishes the drawing, so to add points close together, zoom in (with the mouse wheel or pinch zoom) to do this. If you accidentally finish drawing too soon, you can edit the feature to add or alter points.
The downloaded KML, QPX, or GeoJSON files can be brought back into the Georeferenced Maps viewer using the Add Layer button ![]() , for further editing. You can also open them in any text editor, or open and edit them in QGIS or ArcGIS Online. Read our guide on Opening map datasets in QGIS.
, for further editing. You can also open them in any text editor, or open and edit them in QGIS or ArcGIS Online. Read our guide on Opening map datasets in QGIS.
Go to Full-screen / Draw viewer viewer.
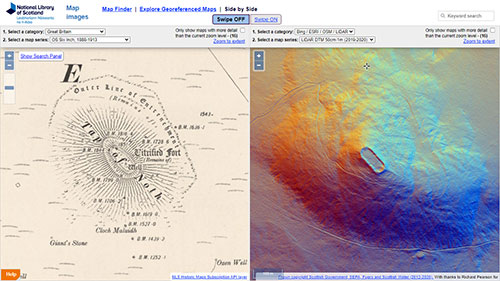
Side by side viewer
Select the 'Side by side' link in the Georeferenced maps viewer header to access this viewer:

The Side by side viewer allows all the different historic map overlays to be compared to each other, or to present day Google, MapBox, OpenStreetMap or Ordnance Survey maps, in a split-screen viewer.
The layer selection lists for each map are near the bottom of the screen. This is to make their position and display consistent with our other georeferenced map viewers, and also to improve their display on smaller screens. Click the Go to former Side by side viewer button (top right) to use the previous viewer layout with the layer selection lists in the header.


- Search placenames, postcodes, Grid References, historic counties/parishes or share your device location to position the maps.
- Choose the map layers that you would like to view. You can choose to show these as a split-list (with two drop-down layers), or as a single list (with one drop-down layer).
As you zoom or pan the 'side by side' maps, the layer lists update dynamically to show just those which cover your current map view.
Select the Zoom to this layer's extents link to zoom to the full geographic extents of the selected layer. - Filter the layers by date, scale or keyword.
- Select the Swipe OFF / Swipe ON buttons in the header to change the central vertical bar, so that it can be moved sideways to compare two maps.
The Search Button ![]() allows you to search using a Gazetteer of Place Names, or by Counties/Parishes (further search information).
allows you to search using a Gazetteer of Place Names, or by Counties/Parishes (further search information).
The Search Button ![]() allows you to search using a Gazetteer of Place Names, or by Counties/Parishes.
allows you to search using a Gazetteer of Place Names, or by Counties/Parishes.
Switch layer lists
You can display the layers as one single list or as a split list:
You can also sort the single list by Relevance, Scale or Date.
Filter layers
By default, the list of layers are filtered by the area you are looking at in the map. If you zoom in, the layer lists reduce to just those covering your smaller area. If you zoom out, the layer lists increase to those covering your wider area.
You can also filter the layers by date, scale or keyword:

- Filter layers by date if you are only interested in layers between a specific date range.
- Filter layers by scale if you are only interested in layers at particular scales.
Check the Filter by scale automatically checkbox if you would like the list of layers to reflect your map zoom level. If checked, when you are zoomed out (at smaller scales), just smaller scale layers are listed; when you are zoomed in (at larger scales), just larger scale layers are listed. - Filter layers by keyword to only select layers containing this keyword in their title. Upper or lower case can be used.
Measurement tools (top right)
The Measurement buttons, to the upper right, allow you to measure:
- Bearing or Azimuth - in degrees from true North
- Area - in square kilometres and square miles / square metres and square feet
- Distance - in kilometres and miles / metres and feet

Click or tap on the buttons to toggle the measurement functions on or off. Once selected, click or tap to add points on your route - the current bearing, distance or area is given. Double-click with the mouse or double tap to stop and finalise the current measurement.
Side by Side viewer - View map - Specific Map Sheet Reference (lower right)
For our largest georeferenced layers, on desktop screens, the specific map sheet or sheets that your cursor is over can be displayed to the lower right at higher zoom levels. Select the Display map details link, and the map sheet details will be shown, so you can view specific dates for the maps on screen, followed by a View map link. If you click this link, it will open the specific map sheet listed as a zoomable image in a new window.

Tips:
- You may need to zoom right in on a specific sheet so that when your cursor moves to the lower right to click the 'View map' link, it is over the same sheet.
- Where map sheets overlap at county or country boundaries, two sheets may be listed which overlay the area shown; one of these sheets will be visible in the georeferenced layer.
If you wish to order maps you are viewing in the Side by side viewer, you will need to view the map in our standard non-georeferenced image viewer to order it. Follow the View map procedure above for this, or switch to the Map Finder viewer by selecting this link in the header to locate the specific map.
Bookmarks / Linking to the viewer
The URL in your web browser address bar changes dynamically as you zoom and pan the map, and when you alter visible map layers and overlays. You can copy or bookmark the URL in your web browser address bar to save the current viewer zoom level, location, and layers:
https://maps.nls.uk/geo/explore/side-by-side/#zoom=5.0&lat=56.00000&lon=-4.00000&layers=1&right=ESRIWorld
- zoom= Map Zoom / Scale / Magnification from 1 to 25
- &lat= Latitude from 0 to 90 +/-
- &lon= Longitude from 0 to 180 +/-
- &layers= Left-hand map layer, unique number or name
- &right= Right-hand map layer, unique number or name
You can create any number of bookmarks to start the viewer focused on a specific location and with your choice of layers.
The Side by Side viewer is accessible directly from the Map Images home page as well as from the Side by side link in the page header of both the Map Finder and Georeferenced Maps viewers. You can return to the standard Georeferenced Maps or Map Finder viewers by following the Georeferenced Maps link in the page header.
Go to Side by side viewer (with Swipe OFF).
Viewer technology
This application uses OpenLayers as its main interface, as well as GeoServer for Web Feature Services. Georeferenced maps have been prepared for online display using MapTiler.
We have released the OpenLayers code behind this viewer on Github for onward use. Please see the GeoCart 2018 - ANZMapS Historical Maps Online Workshop, for a set of freely downloadable basic OpenLayers viewers with code and notes. For further details, please consult the following:
- Fleet, C. (2019a) 'An open-source web-mapping toolkit for libraries', e-Perimetron 14(2), pp. 59-76. View Fleet 2019a online.
- Fleet, C. (2019b) 'Creating, managing, and maximising the potential of large online georeferenced map layers’, e-Perimetron 14(3), pp. 140-149. View Fleet 2019b online.
- Fleet, C. (2022) Understanding user needs: a case study from the National Library of Scotland. Digital Preservation Coalition Technology Watch Guidance Note. http://doi.org/10.7207/twgn22-01. View Fleet 2022 online.
Please email maps@nls.uk for further assistance, or to provide general comments/feedback.